Flood Simulation Maps Nan City as Water Levels Rise
GISTDA released flood simulation maps for Nan City on August 20 as water levels approached 201.50 meters, using color-coded depths to help authorities plan evacuations and rescue operations across affected areas.
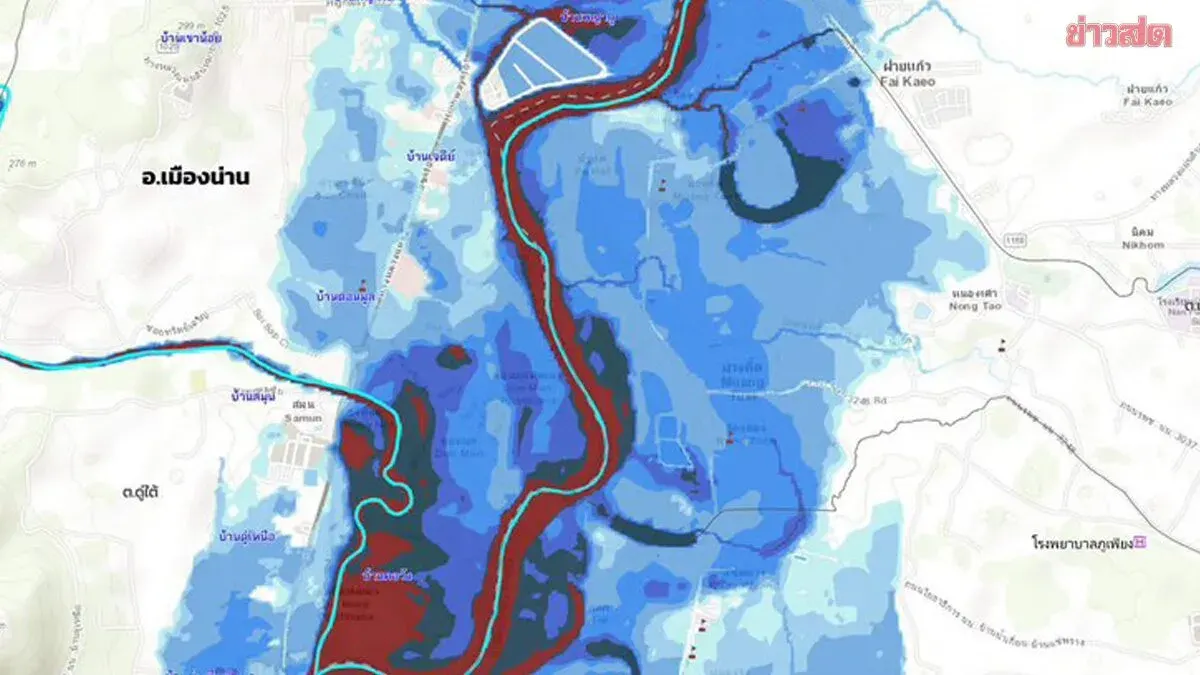
The Geo-Informatics and Space Technology Development Agency (GISTDA) released flood simulation maps for Muang Nan district on August 20 to assist in assessing and monitoring the flood situation. The maps are based on water level forecasts at monitoring station N.1 (Nai Wiang subdistrict), which are expected to reach 201.50 meters above mean sea level. As of 10 p.m. on August 19, water levels at station N.1 had already exceeded 200 meters. The simulation maps use color coding to indicate flood depth across different areas: light blue for shallow flooding (0.5 to 1 meter), blue to dark blue for moderate flooding (1 to 3 meters), dark blue to navy for deep flooding (3 to 5 meters), and dark red for severe flooding (over 5 meters, mainly along riverbeds and low-lying areas). The maps also display critical spatial data including roads, water sources, buildings, schools, and hospitals. This information is essential for local authorities and residents to plan evacuations, move valuables to higher ground, avoid cut-off routes, and coordinate rescue efforts effectively. The public and relevant agencies can access additional disaster information by scanning QR codes on the maps or visiting the GISTDA disaster website at http://disaster.gistda.or.th to monitor the situation closely.